|
The SSIM
Index for Image Quality Assessment Zhou Wang, Alan C. Bovik,
Hamid R.
Sheikh and Eero
P. Simoncelli
|
|

![]() Visit the
webpage of SSIMplus, a novel perceptual
video quality-of-experience (QoE) index designed for
practical use and in many ways goes far beyond what SSIM can do.
Visit the
webpage of SSIMplus, a novel perceptual
video quality-of-experience (QoE) index designed for
practical use and in many ways goes far beyond what SSIM can do.
The Structural SIMilarity
(SSIM) index is a method for measuring the similarity between two images. The
SSIM index can be viewed as a quality measure of one of the images being
compared, provided the other image is regarded as of perfect quality. It is an
improved version of the universal
image quality index proposed before. Detailed description is given
in the following paper:
1.
Z. Wang, A. C. Bovik, H.
R. Sheikh and E. P. Simoncelli,
"Image quality
assessment: From error visibility to structural similarity," IEEE Transactions on Image Processing, vol. 13, no. 4, pp. 600-612, Apr. 2004.
A Matlab implementation of the SSIM index (ssim_index.m) is available here. You can download it for
free, change it as you like and use it anywhere, but please refer to its
original source (cite the above paper and this web page).
Before
using the code, please go through the suggested usage
and demo tests below to get an
idea on how to use it and how it works.
Suggested
Usage
The above (ssim_index.m)
is a single scale version of the SSIM indexing measure, which is most effective
if used at the appropriate scale. The precisely “right” scale depends on both
the image resolution and the viewing distance and is usually difficult to be
obtained. In practice, we suggest to use
the following empirical formula to determine the scale for images viewed from a
typical distance (say 3~5 times of the image height or width): 1) Let F = max(1, round(N/256)), where N is the number of pixels in
image height (or width); 2) Average local F by F pixels and then downsample the image by a factor of F; and 3) apply the ssim_index.m program. For example, for an 512 by 512 image,
F = max(1, round(512/256)) = 2, so the image should be
averaged within a 2 by 2 window and downsampled by a
factor of 2 before applying ssim_index.m.
The Matlab
code (ssim.m) that includes the suggested downsampling process described above is given here:
Other
Useful Downloads
The SSIM values are computed (using ssim.m) for 6 publicly available subject-rated image
databases, including LIVE
database, Cornell
A57 database, IVC database,
Toyama database, TID2008 database, and CSIQ database. When the images are in
RGB color, an Matlab
function “rgb2gray” is used to convert the images to gray scale. The results (in
Matlab .mat format) are provided here, together with
performance evaluations based on Spearman’s rank correlation coefficient (SRCC)
and Kendall’s rank correlation coefficient (KRCC), for future comparisons:
|
Database |
Toyama |
SRCC |
KRCC |
|
LIVE |
0.9479 |
0.7963 |
|
|
Cornell-A57 |
0.8066 |
0.6058 |
|
|
IVC |
0.9018 |
0.7223 |
|
|
Toyama-MICT |
0.8794 |
0.6939 |
|
|
TID2008 |
0.7749 |
0.5768 |
|
|
CSIQ |
0.8756 |
0.6907 |
A tutorial paper is published at
2.
Z.
Wang and A. C. Bovik, “Mean squared
error: love it or leave it? - A new look at signal fidelity measures,” IEEE Signal Processing Magazine, vol.
26, no. 1, pp. 98-117, Jan. 2009.
Powerpoint and PDF figures of the above paper are available here
for references:
MATLAB, C, C++, Java and LabView
implementations of the SSIM index have also been made available online by other
authors:
·
C++
implementation by Lefungus at http://perso.wanadoo.fr/reservoir/
·
C++
implementation by Mehdi Rabah at http://mehdi.rabah.free.fr/SSIM/
·
C++
implementation by Naru Kinjo at http://denshika.cc/open/20100630/,
http://denshika.cc/open/20100630/batch.php
·
C++ OpenCV implementation (wrapper of Mehdi Rabah
and Naru Kinjo’s work) by Norishige
Fukushima at http://nma.web.nitech.ac.jp/fukushima/opencv/ssim/ssim-e.html
·
C
implementation of RGBA SSIM for comparing PNG images by porneL at http://pornel.net/dssim
·
C
implementation of SSIM and MS-SSIM by Tom Distler at http://tdistler.com/iqa/
·
Java
implementation by Gabriel Prieto at http://rsb.info.nih.gov/ij/plugins/ssim-index.html and http://www.ucm.es/gabriel_prieto/ssim
·
Java
implementation of Multi-scale SSIM by Gabriel Prieto at http://rsb.info.nih.gov/ij/plugins/mssim-index.html
and http://www.ucm.es/gabriel_prieto/ms-ssim
·
LabView implementation at LIVE: http://live.ece.utexas.edu/research/quality/SSIM.llb
·
More
efficient MATLAB implementation of SSIM by Adam Turcotte at http://ssim.rivetsforbreakfast.com/
·
Python
implementation of SSIM by Antoine Vacavant at http://isit.u-clermont1.fr/~anvacava/code.html
·
Python
implementation of SSIM (improved upon Antoine Vacavent’s
version) by Helder C. R. de Oliveira at http://helderc.net/
Extensions
and Related Papers
The following papers discuss the
extensions and improvements of the SSIM index approach:
3.
D. Brunet, E.
R. Vrscay and Z. Wang, “On
the mathematical properties of the structural similarity index,” IEEE
Transactions on Image Processing, vol. 21, no. 4, pp. 1488-1499, Apr. 2012.
4.
Z.
Wang and Q. Li, "Information
content weighting for perceptual image quality assessment," IEEE Transactions on Image Processing, vol. 20, no 5, pp. 1185-1198, May 2011. [Web and code]
5.
M. P. Sampat, Z. Wang, S. Gupta, A. C. Bovik and M. K. Markey, "Complex
wavelet structural similarity: A new image similarity index," IEEE
Transactions on Image Processing, vol. 18, no. 11, pp. 2385-2401, Nov. 2009.
6.
Z.
Wang and Q. Li, "Video
quality assessment using a statistical model of human visual speed perception,"
Journal of the Optical Society of
America A, vol. 24, no. 12, pp. B61-B69, Dec.
2007.
7.
Z.
Wang and X. Shang, “Spatial
pooling strategies for perceptual image quality assessment,” IEEE International Conference on
Image Processing,
8.
Z.
Wang and E. P. Simoncelli, “Translation
insensitive image similarity in complex wavelet domain,” IEEE International Conference
on Acoustics, Speech and Signal Processing, vol. II, pp. 573-576,
Philadelphia, PA, Mar. 2005.
9.
Z.
Wang, L. Lu,
and A.
C. Bovik, “Video
quality assessment based on structural distortion measurement,” Signal Processing: Image
Communication, special issue on “Objective video quality metrics”, vol. 19,
no. 2, pp. 121-132, Feb. 2004.
10.
Z.
Wang, E.
P. Simoncelli and A.
C. Bovik, “Multi-scale
structural similarity for image quality assessment,” Invited Paper, IEEE Asilomar Conference on
Signals, Systems and Computers, Nov. 2003. [Matlab Code] [Java Code 1, Java Code 2]
Other related papers:
11. A. Rehman,
Y. Gao, J. Wang, Z.
Wang, “Image
classification based on complex wavelet structural similarity,” Signal Processing: Image Communication,
special issue on Biologically Inspired Approaches for Visual Information
Processing and Analysis, vol. 28, no. 8, pp. 984-992, Sep. 2013.
12. S. Wang, A. Rehman,
Z. Wang, S. Ma and W. Gao,
“SSIM-inspired
divisive normalization for perceptual video coding,” IEEE Transactions on Image Processing, vol. 22, no. 4, pp. 1418-1429, Apr. 2013.
13. A. Rehman
and Z.
Wang, “Reduced-reference
image quality assessment by structural similarity estimation,” IEEE Transactions on Image Processing,
vol. 21, no. 8, pp. 3378-3389, Aug. 2012.
14.
S. Wang, A. Rehman, Z. Wang, S. Ma and W. Gao,
“SSIM-motivated
rate distortion optimization for video coding”, IEEE Transactions on
Circuits and Systems for Video Technology, vol. 22, no. 4, pp. 516-529,
Apr. 2012.
15. A. Rehman,
M. Rostami, Z. Wang, D.
Brunet
and E.
R. Vrscay, “SSIM-inspired
image restoration using sparse representation,” EURASIP Journal on Advances in Signal Processing, special issue on
Image and Video Quality Improvement Techniques for Emerging Applications, Jan.
2012.
16.
Z.
Wang and E. P. Simoncelli, “Maximum
differentiation (MAD) competition: A methodology for comparing computational
models of perceptual quantities,” Journal
of Vision, vol. 8, no. 12, Sept. 2008.
17.
Z.
Wang and E. P. Simoncelli, “An
adaptive linear system framework for image distortion analysis,” IEEE International Conference
on Image Processing,
18.
Z.
Wang, A. C. Bovik and E. P. Simoncelli, “Structural
Approaches to image quality assessment,” in Handbook of Image and Video
Processing (Al Bovik, ed.), 2nd edition, Academic
Press, June 2005.
19.
Z.
Wang and E. P. Simoncelli, “Stimulus
synthesis for efficient evaluation and refinement of perceptual image quality
metrics,”
Human Vision and Electronic Imaging IX, Proc. SPIE, vol. 5292, Jan. 2004.
20.
Z.
Wang, H.
R. Sheikh and A. C. Bovik, “Objective
video quality assessment,” in The Handbook of Video Databases: Design and Applications
(B. Furht and O. Marqure,
eds.), CRC Press, pp. 1041-1078, Sept. 2003.
21.
Z.
Wang, A. C. Bovik and L. Lu, “Why is image quality assessment so difficult?” IEEE International Conference on
Acoustics, Speech, & Signal Processing, May 2002.
22.
Z.
Wang, and A. C. Bovik, “A
universal image quality index,” IEEE Signal Processing Letters,
vol. 9, no. 3, pp. 81-84, March 2002.
Demonstration
In the following, all distorted
images have roughly the same mean squared error (MSE) values with respect to
the original image, but very different quality. SSIM gives a much better
indication of image quality.
|
Original, MSE = 0; SSIM = 1 |
MSE = 144, SSIM = 0.988 |
MSE = 144, SSIM = 0.913 |
|
MSE = 144, SSIM = 0.840 |
MSE = 144, SSIM = 0.694 |
MSE = 142, SSIM = 0.662 |


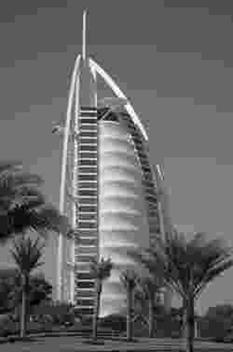
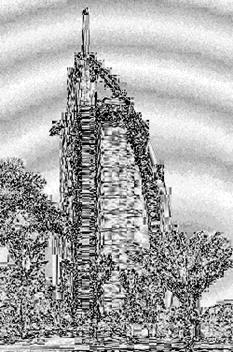
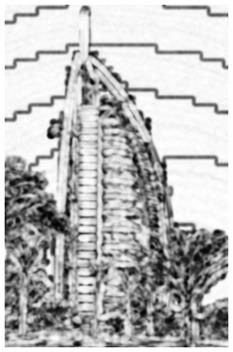
The following
example illustrates the maximal/minimal SSIM images synthesized along the
equal-MSE hypersphere in the space of all images. All
images along the hypersphere have the same MSE values
with respect to the reference image, but have drastically different perceptual
quality.
The following example demonstrates the SSIM index map,
which provides a measurement of local image quality over space. Note that
severe JPEG compression produces annoying pseudo-contouring effects (in the sky
region) and blocking artifacts (along the boundaries of the building), which
are successfully captured by the SSIM index map, yet poorly predicted by the
absolute error map (in both distortion/quality maps,
brighter indicates better quality).
|
Original image |
JPEG compressed
image |
Absolute error
map |
SSIM index map |

Test
on LIVE Image Database
The SSIM indexing algorithm has been
tested on the LIVE
database created at the Lab
for Image and Video Engineering (LIVE) at the University of Texas at Austin.
The database is subject-rated and available for free download.
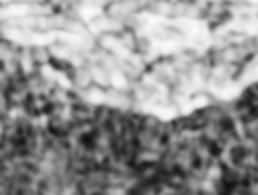
First Stage LIVE database test
In the first stage, the database
contained 460 images, where 116 were original images and the rest 344 are JPEG
and JPEG2000 compressed. Two sample images (cropped from 768X512 to 256X192 for
visibility) are shown below. Note that quantization in JPEG and JPEG2000 algorithms often
results in smooth representations of fine detail regions (e.g., the tiles in
the upper image and the trees in the lower image). Compared with other types of
regions, these regions may not be worse in terms of pointwise
difference measures (as shown in the absolute error map). However, since the
structural information of the image details are nearly completely lost, they
exhibit poorer visual quality. Close piece-by-piece comparison of the SSIM
index and the absolute error maps, we observe that the SSIM index is more
consistent with perceived quality measurement. Note: in both distortion/quality
maps, brighter means better quality.
|
Original Images |
JPEG/JPEG2000 Compressed Images |
Absolute Error
Map |
SSIM Index Map |
|
|
|
|
|
|
|
|
|
|
The scatter plots of the subjective measurement (mean opinion score,
MOS) versus the objective predictions (PSNR and MSSIM) are shown below, where
each point represent one test image. Clearly, MSSIM is much better in
predicting the perceived image quality.
|
|
|
|
PSNR vs. MOS |
MSSIM vs. MOS |
Full LIVE database test
The LIVE database was later developed
to contain more diverse distortion types, including JPEG2000 compression, JPEG
compression, Gaussian noise contamination, Gaussian blur, and JPEG2000
compressed images undergoing fast fading channel distortions. The full database
contains 982 images, with 203 original and 779 distorted images. The SSIM index
was computed with the full database and the SSIM values for all images are
provided in the following file (in Matlab .mat
format) for future comparisons:
SSIM results for LIVE database
Created
Feb. 2003
Last
updated Nov. 9, 2014
![]()
![]()